


Understanding data is crucial in today's world, and statistics play a key role in making sense of it all. The core tasks of statistics involve collecting, analyzing, interpreting data, and using that information to draw conclusions about larger populations or situations.
However, within the realm of statistics, two distinct approaches emerge: descriptive and inferential.
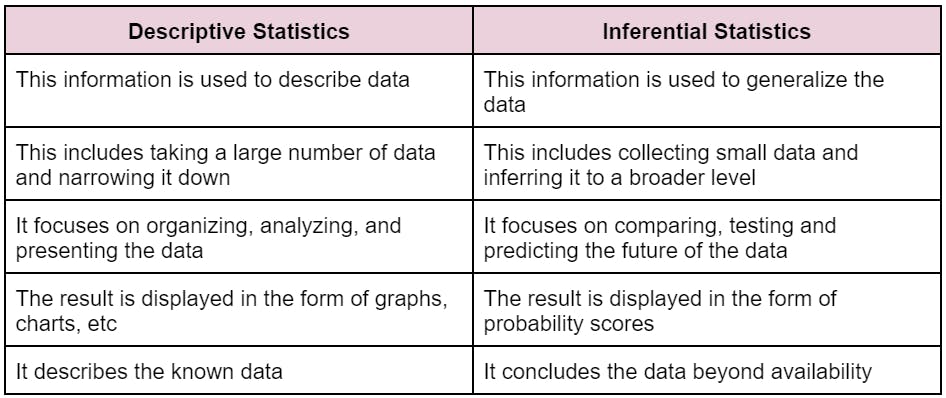
Descriptive Statistics:
It consists of the collection, analysis, and interpretation of data
Its main purpose is to understand the main features of the data
It has various functions for organizing and summarizing the data
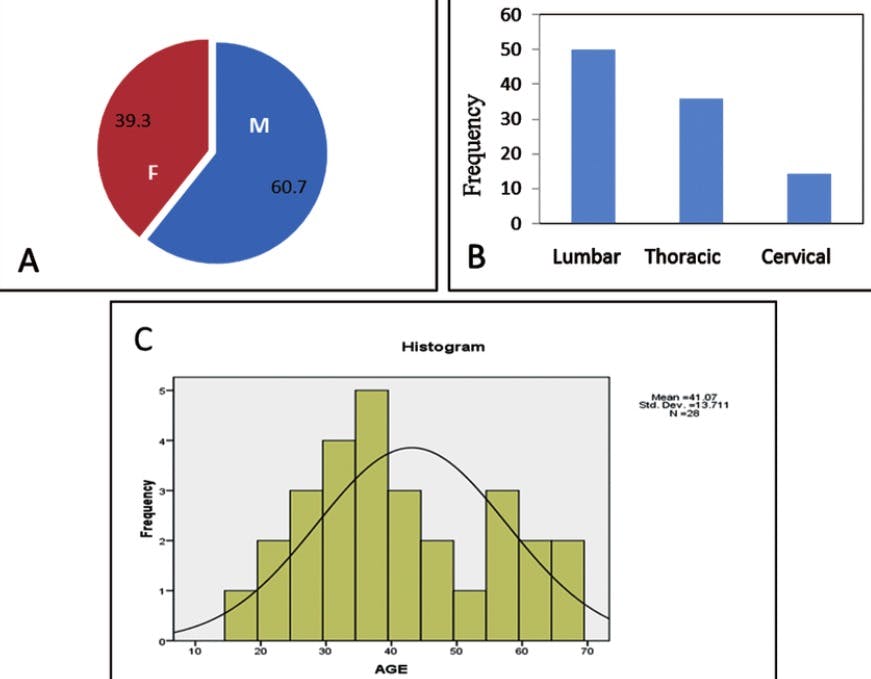
Graphs, tables, pie charts, averages, and variations fall under this
For example, imagine we're interested in the exam scores of a large class with 100 students (sample). We gather all their scores and use descriptive statistics to understand the main features. We calculate the average score to see where most students land, the median score to find the middle value, and the standard deviation to gauge how spread out the scores are. This gives us a clear picture of the overall performance and distribution of scores within this specific class.
Inferential Statistics:
It uses data from a smaller, representative sample to draw conclusions and make generalizations about a larger population.
By analyzing the sample and applying statistical models, we can test hypotheses about the population's characteristics and quantify the uncertainty associated with our conclusions.
For example, imagine we have 1000 students (population) and want to understand their average exam score. We might select a representative sample of 100 students, analyze their scores, and then draw conclusions about the average score of the entire student body.

To put it simply:
- Descriptive statistics describes the data
- Inferential statistics studies a sample of the same data
Day 1 down, 99 to go! Thoughts on Day 1? Anything you'd love to see tweaked for tomorrow's dive? #100DaysofAnalytics